“Systems thinking” gets tossed around a lot. Half the time it means, “Relax, it’s complicated,” said by someone who doesn’t plan to do anything about it.
This post is the opposite of that.
It’s a cheat sheet: 12 practical tools with plain-English definitions, when they matter, and a 15-minute drill you can run without booking a workshop, lighting candles, or summoning a maturity model.
Prologue: Why the Monster Keeps Coming Back
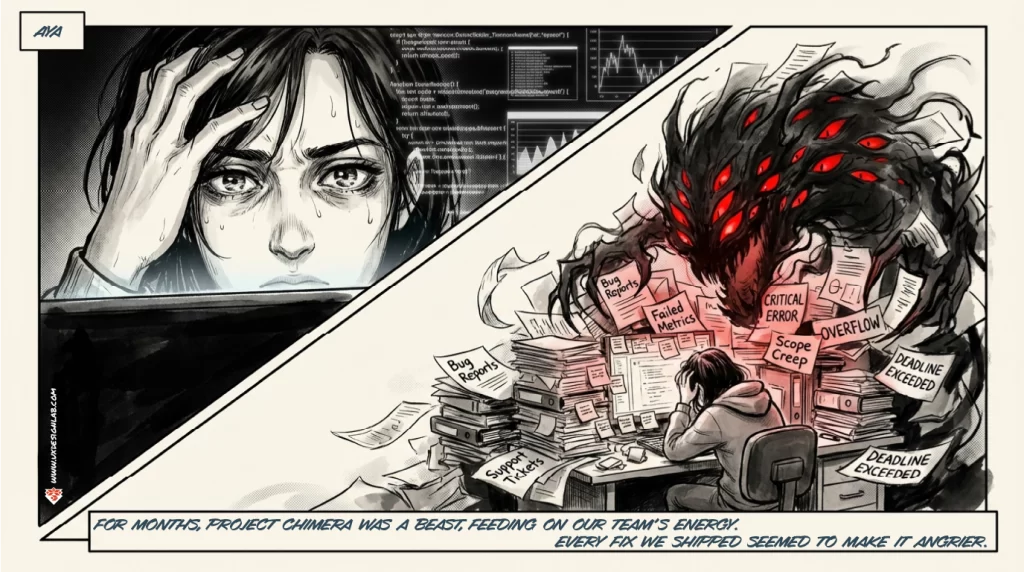
Project Chimera is the standard enterprise beast: bugs, churn, support tickets, angry stakeholders, and a backlog that breeds at night.
Here’s the pattern: you ship a “fix,” everyone celebrates, and two sprints later the same problem returns wearing a different hat.
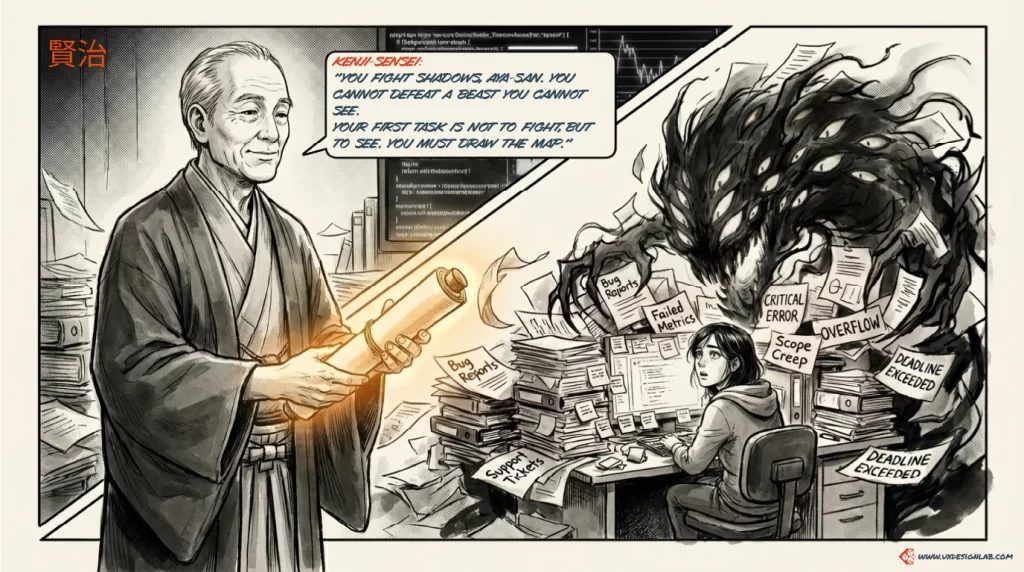
That’s what happens when you patch symptoms inside a system you never bothered to map. The first job isn’t to fight. It’s to see.
Before we head out, here’s the quick map for the tl;dr crowd:
| Scrolls | Tool Cluster | When it matters |
|---|---|---|
| 1–5 | Discovery | When you’re fighting shadows or invisible “blocks.” |
| 6–7 | Incentives | When “good design” keeps getting killed by politics. |
| 8–9 | Framing | When stakeholders are solving the wrong problem. |
| 10–11 | Delivery | When everything is slow and “optimizing” changes nothing. |
| 12 | Post‑ship | When you need to see if your “fix” actually worked. |
The Twelve Scrolls
1. The Unseen Map (Systems Map)
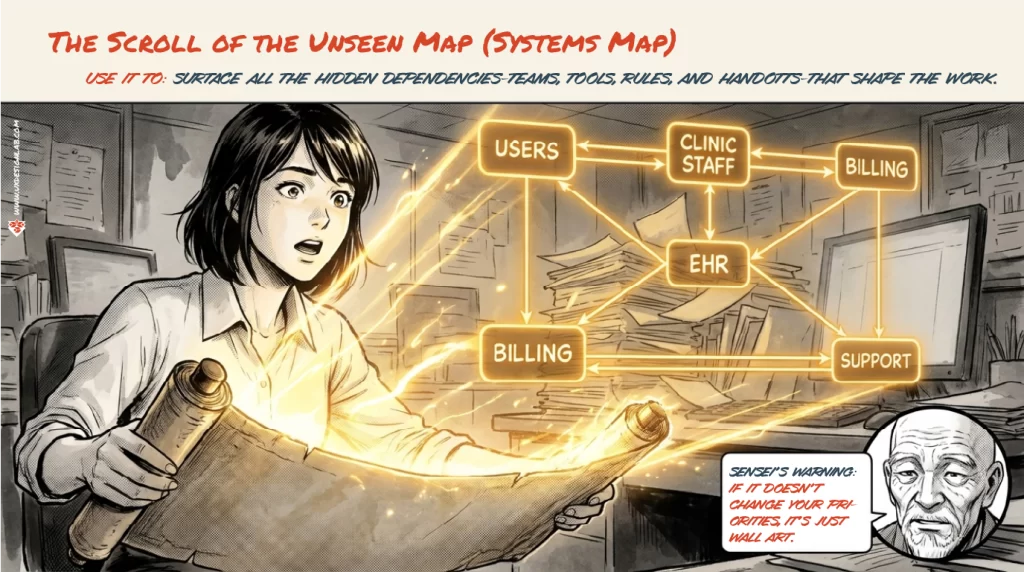
You unroll the first scroll and sketch the terrain, who touches what, where it changes hands, and where the rules actually live.
Plain English: Draw the whole playing field: teams, tools, policies, handoffs, data. So you stop designing in a vacuum.
When it matters: When everything feels “blocked,” and nobody can explain why.
15-minute drill: List every actor that touches the experience. Draw the handoffs. Circle the top 3 dependencies you don’t control.
Output: A one-page map that tells you what actually sets your limits.
Common failure: Making a pretty diagram that changes zero decisions.
Sensei’s warning: If it doesn’t change your priorities, it’s a decoration.
2. The Serpent’s Cycle (Causal Loop)
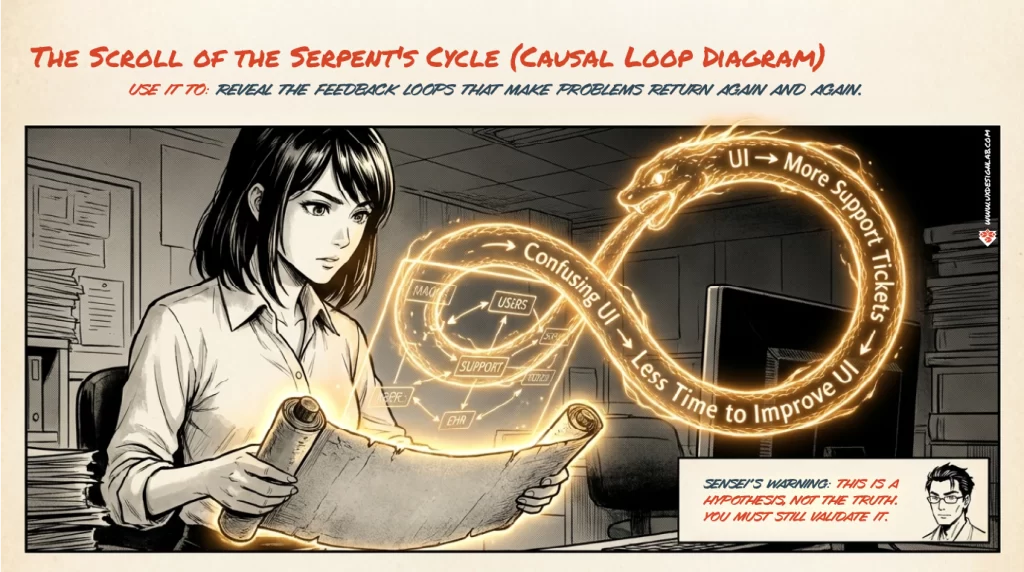
Next, you spot the serpent and draw the loop that keeps feeding it, so you stop chasing symptoms.
Plain English: Show the feedback loops that keep resurrecting the same problem.
When it matters: When issues reappear after every “fix,” like bugs with nine lives.
15-minute drill: Write the loop: Confusing UI → More support tickets → Less time to improve UI → UI stays confusing.
Output: A testable theory of cause and effect.
Common failure: Treating the loop like gospel instead of a hypothesis.
Sensei’s warning: This is a theory. Validate it, or it will betray you.
3. The River and the Dam (Stock & Flow)
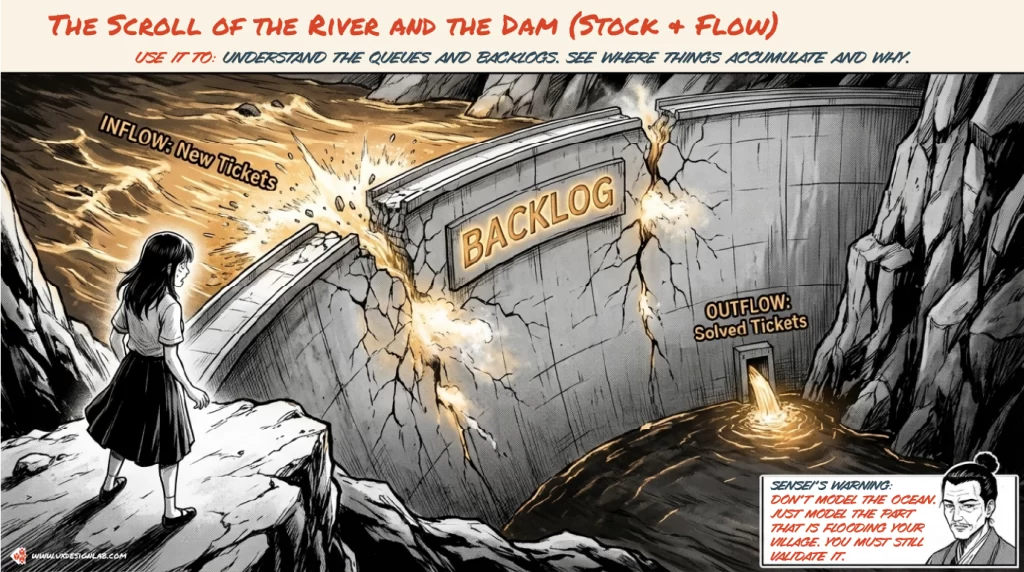
At the river, you stop calling it “slow” and name what’s pooling, what’s pouring in, and what actually drains out.
Plain English: Understand queues and backlogs by seeing where work piles up, and why it doesn’t drain.
When it matters: Support tickets, onboarding queues, approvals, compliance reviews… anything that “accumulates.”
15-minute drill: Name the stock (what’s piling up). Identify inflows (new work) and outflows (completed work).
Output: The real constraints controlling flow (not the ones people blame in meetings).
Common failure: Modeling the entire ocean instead of the part flooding your village.
Sensei’s warning: Don’t model the ocean. Model the flood.
4. The Dragon’s Vein (Leverage Points)
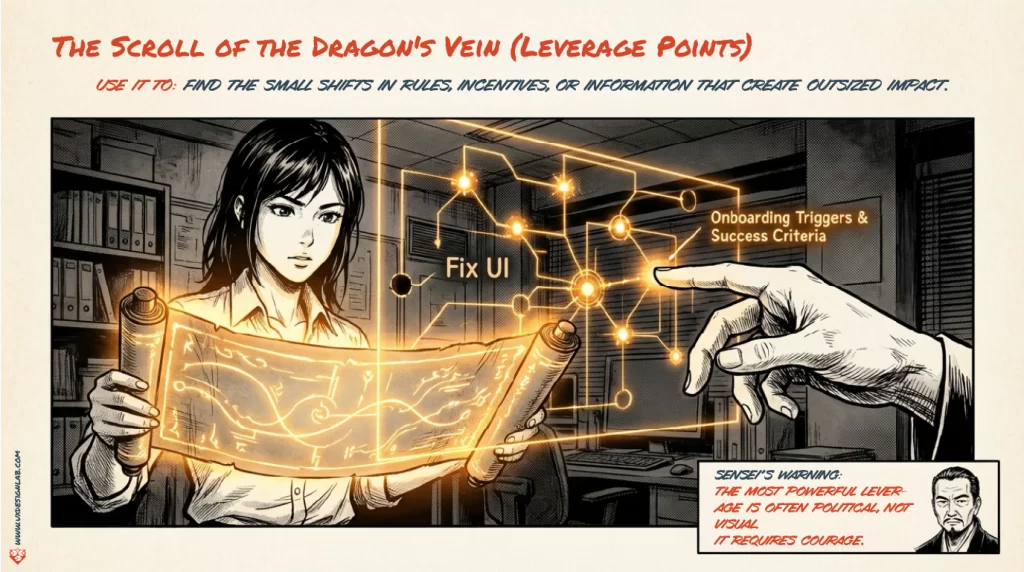
You hunt for the dragon’s vein, one lever that changes the rules, incentives, or constraints.
Plain English: Find the smallest change that creates a disproportionate impact.
When it matters: When you’re drowning in requests and need the one move that actually changes the game.
15-minute drill: List 10 changes. Pick the one that alters a rule, incentive, or constraint, not the pixels.
Output: A single “lever” worth taking to leadership.
Common failure: Picking the most visible lever instead of the most powerful one.
Sensei’s warning: The strongest leverage is often political, not visual.
5. The Hidden Stage (Service Blueprint)
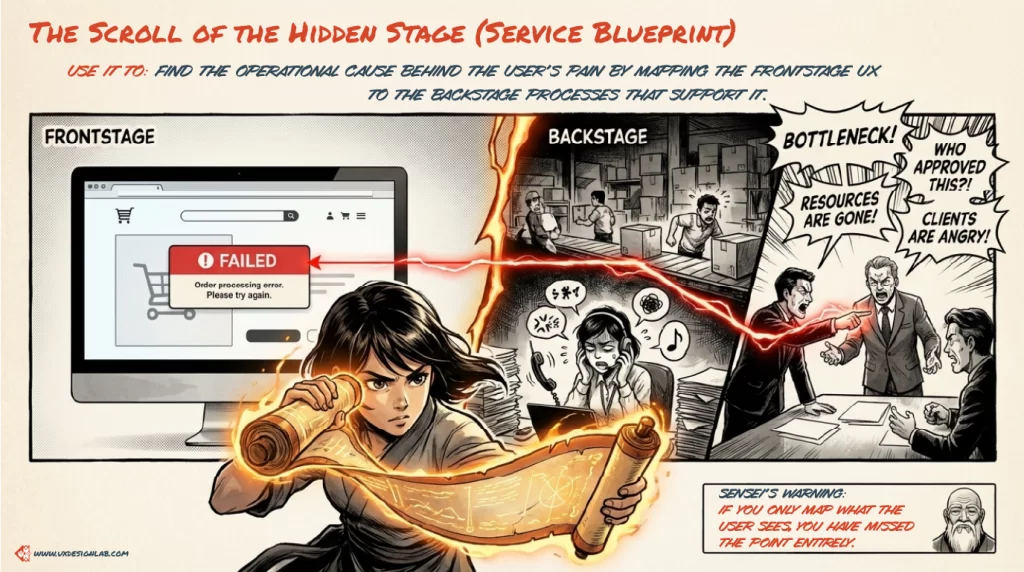
You step behind the curtain and follow the backstage handoffs, approvals, and quiet delays running the show.
Plain English: Map the frontstage UX to the backstage process that makes it possible (or impossible).
When it matters: When user pain is caused by internal bottlenecks: approvals, handoffs, staffing gaps, broken tooling.
15-minute drill: Write the user steps. Under each, list internal actions required to support them. Circle the steps with delays.
Output: Proof that the “UX problem” lives in ops, not UI.
Common failure: Mapping only what the user sees.
Sensei’s warning: If you only map the frontstage, you missed the point.
6–7. The Forest and the Trade Routes (Ecosystem Map + Value Network)
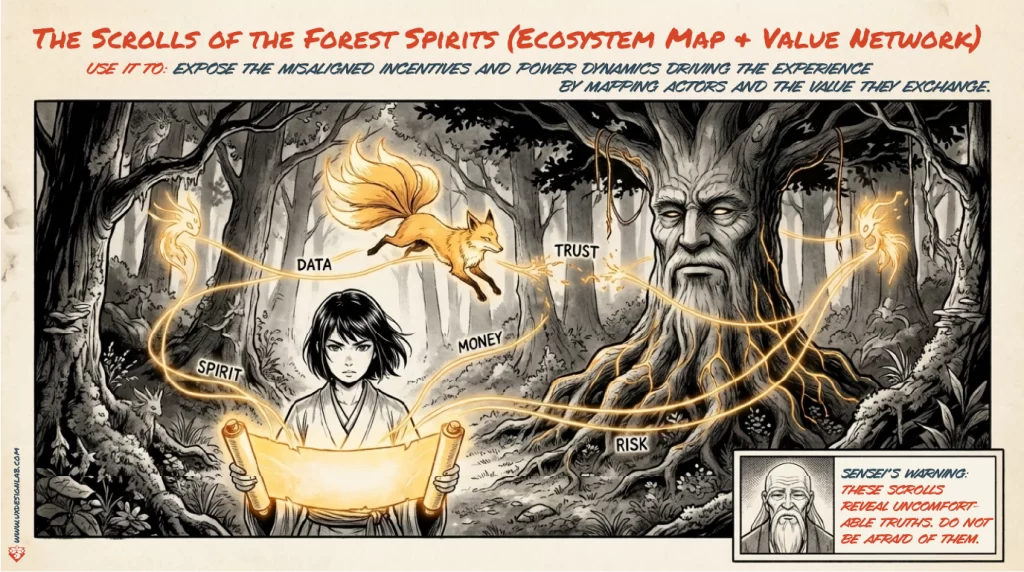
You step into the Forest. First, you figure out who’s actually here. Then you trace the Trade Routes, what they’re really swapping to keep the place running (money, data, risk, compliance… and Spirit). Same scene, two lenses: people and exchange.
The Forest (Ecosystem Map)
Plain English: Name every actor in the landscape, then draw who can block you, fund you, or quietly starve you.
When it matters: When five groups “own” the experience, and each one means something different by the word success.
15-minute drill: List the actors. Draw connections. Mark:
- who approves
- who funds
- who supports
- who gets blamed
Output: A power-and-dependency map you can design around.
Common failure: Calling it “stakeholder alignment” and then ignoring the actual power.
The Trade Routes (Value Network)
Plain English: Show what actors actually exchange: Money, Time, Trust, Data, Risk, Compliance… and Spirit — the team’s energy, attention, and will‑to‑build. Trade too much Spirit for Compliance and you don’t get “stability,” you get burnout and a slow leak in capability (and velocity).
When it matters: When the system resists change despite “perfect” design.
15-minute drill: For every connection, label the trade:
- What do they give?
- What do they get?
- What do they fear losing?
- Where is Spirit being burned to keep Compliance fed?
Output: A map of misaligned incentives, aka the real reason your “improvement” gets slow-walked.
Common failure: Assuming everyone wants the same outcome.
Sensei’s warning: If you ignore Spirit, your plan will look great and die quietly.
8–9. The Compass and the Weather (CATWOE + System Archetypes)
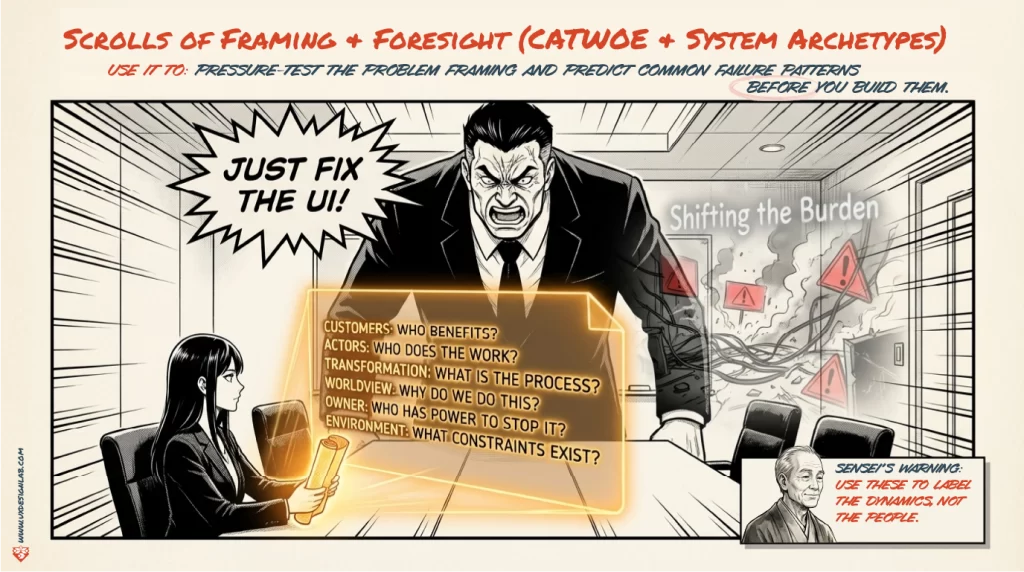
You pause and pull out two tools: a compass and a glance at the weather. CATWOE sets your direction, what problem we’re actually solving, for whom, under what constraints. Archetypes tell you what kind of storm you’re walking into if you keep doing what you’re doing.
CATWOE (Framing)
Plain English: Pressure-test the framing by naming who benefits, who does the work, and what constraints are real.
When it matters: When someone says “just fix the UI” while the process rots underneath.
15-minute drill: Define: Customers, Actors, Transformation, Worldview, Owner, Environment.
Output: A reframed problem statement that stops the team from solving the wrong thing beautifully.
Common failure: Using it to attack people instead of labeling dynamics.
Sensei’s warning: Label the system. Don’t label the humans.
System Archetypes (Foresight)
Plain English: Recognize common failure patterns before you reenact them.
When it matters: When you smell Shifting the Burden, Fixes That Fail, or Limits to Growth coming.
15-minute drill: Pick the archetype that best matches today’s chaos. Write the “usual ending.”
Output: A short foresight note: “If we keep doing this, here’s what happens next.”
Common failure: Calling everything an archetype and never changing behavior.
10–11. The Gate and the Maze (Theory of Constraints + Root Cause Analysis)
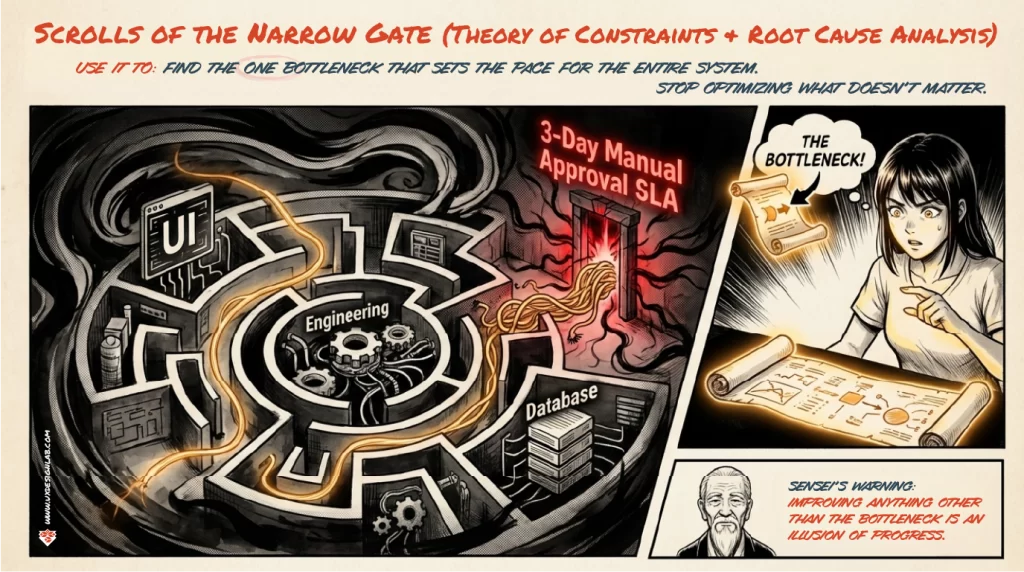
You reach the Gate, the place where everything bottlenecks. First, you name where the system is throttling. Then you run the Maze to find why the throttle exists: UI friction, code limits, data limits, or a human approval loop. Same diagnosis, two beats.
The Narrow Gate (Theory of Constraints)
Plain English: Find the one bottleneck that sets the pace for the entire system.
When it matters: When you’re “optimizing” everywhere, and nothing gets faster.
15-minute drill: Identify the step everything waits on (approval, manual QA, legal review, a single database write, etc.).
Output: A bottleneck statement leadership can’t ignore.
Common failure: Improving anything except the bottleneck.
Sensei’s warning: Improving anything other than the constraint is performance art.
The Maze Behind the Gate (Root Cause Analysis)
Plain English: Trace the bottleneck back to its real source: code, data, or human-in-the-loop. So you stop arguing in circles.
When it matters: When everyone agrees there’s a constraint… and then fights about whether it’s “engineering,” “the database,” or “the UI.”
15-minute drill: Start at the bottleneck (the Narrow Gate). Then pick one maze wall. Where does the constraint actually live?
- Perception Wall (UI): Extra steps because the system can’t decide automatically?
- Logic Wall (Engineering): Hard implementation limits, missing automation, brittle services?
- Memory Wall (Database/Data): Data models, query performance, integrity constraints, creating the lag?
- Human Wall (Approval loop): Compliance, legal, or manual review acting as the throttle?
Choose the primary wall and write one sentence: “The constraint lives in X, because Y.”
Output: A home for the problem, because you can’t fix a database constraint with a UI redesign, and you can’t automate a legal review with better typography.
Common failure: Stopping at the first answer that sounds polite.
Sensei’s warning: If you can’t name the constraint’s home (UI/code/data/humans), you’re not at the root.
12. The Watchful Eye (Instrumentation)
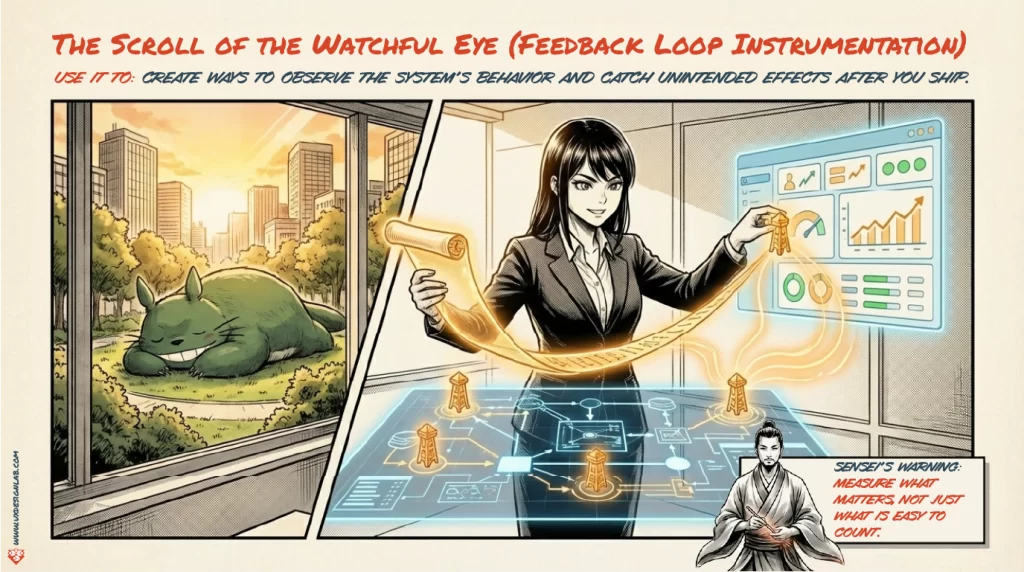
Before you leave, you set watchers: signals for outcome, health, and side effects. So the system can’t surprise you later.
Plain English: Create ways to observe system behavior after you ship, so you catch unintended consequences early.
When it matters: Any time you worry about regressions, dark patterns, or “it felt better but got worse.”
15-minute drill: Pick 3 metrics: one user outcome, one system health metric, one side-effect metric.
Output: A feedback loop you can steer with.
Common failure: Measuring what’s easy to count instead of what matters.
Sensei’s warning: Counting is not knowing.
Conclusion: The Beast Was a System

The “monster” was never a monster. It was a system doing what systems do: protecting its incentives, enforcing its constraints, and punishing shallow fixes.
Once you see the loops, bottlenecks, and trade-offs, you stop flailing and start steering.
Do this today (15 minutes, no ceremony):
- Pick one recurring mess.
- Use Scroll 1 + Scroll 10 to draw the map and find the constraint.
- Post the output somewhere visible.